PREVIOUS
✖
Annual Survey of Industries (ASI) 2022-23
October 8 , 2024
277 days
2834
0
Annual Survey of Industries (ASI) 2022-23
(இதன் தமிழ் வடிவத்திற்கு இங்கே சொடுக்கவும்)
Introduction
- The Ministry of Statistics and Programme Implementation (MoSPI) has recently released the results of the Annual Survey of Industries (ASI) for the financial year 2022-23.
- This survey covers the period from April 2022 to March 2023.
- The ASI, referred to as ASI 2022-23, involved extensive fieldwork conducted between November 2023 and June 2024.
- The ASI is a vital tool for capturing and analysing the dynamics of the manufacturing sector in India.
- Objective: Its primary objective is to provide meaningful insights into the changes in composition, growth, and structure of various industries.
- By examining key parameters such as output, value added, employment, and capital formation, the ASI serves as an essential resource for policymakers, economists, and researchers.
- The findings from ASI 2022-23 contribute significantly to the National Accounts Statistics at both national and state levels.
- This data is crucial for understanding economic performance and trends within the manufacturing sector.
- It enables informed decision-making and strategic planning.
Manufacturing Industries Job Growth at 12-Year High
- Historic Employment Increase: The total number of employees in manufacturing industries rose by 7.5%, reaching 1.84 crore in 2022-23.
- This is an increase from 1.72 crore in 2021-22.
- This marks the highest rate of employment growth in the manufacturing sector in the last 12 years.
Leading Sectors:
- The highest employment was recorded in factories producing:
- Food Products
- Textiles
- Basic Metals
- Wearing Apparel
- Motor Vehicles, Trailers, and Semi-Trailers
Factory Growth and Recovery
- Increase in Factories: The total number of factories rose from 2.49 lakh in 2021-22 to 2.53 lakh in 2022-23, marking the first full recovery phase following the Covid-19 pandemic.
Informal Sector Employment Decline
- Informal Employment Trends:
- In contrast, the number of workers employed in the informal sector has seen a decline.
- According to the Annual Survey of Unincorporated Enterprises (ASUSE) for 2022-23, the informal sector lost approximately 16.45 lakh workers.
- This represents a drop of about 1.5%, bringing the total to 10.96 crore workers.
- This figure is down from 11.13 crore in 2015-16.
Insights on Manufacturing Sector Growth
- Post-Covid Recovery:
- Thus, this data indicates a clear recovery from the Covid shock, highlighting an upswing in the manufacturing sector.
ASI Overview
- Survey Coverage:
- The ASI serves as the principal source of industrial statistics, focusing on organized manufacturing.
- It includes factories employing 10 or more workers using power and those employing 20 or more workers without power.
Key Growth Drivers
- Main Contributors to Growth: Key industries driving manufacturing growth in 2022-23 included in the following.
- Basic Metal
- Coke & Refined Petroleum Products
- Food Products
- Chemical Products
- Motor Vehicles
Employment Contribution by States
- Top Five States: The five states employing the highest number of persons in manufacturing are given below.
- 1. Tamil Nadu
- 2. Maharashtra
- 3. Gujarat
- 4. Uttar Pradesh
- 5. Karnataka
Gross Value Added (GVA)
- GVA Rankings: In terms of Gross Value Added (GVA) for 2022-23, the rankings are as follows.
- 1. Maharashtra
- 2. Gujarat
- 3. Tamil Nadu
- 4. Karnataka
- 5. Uttar Pradesh
- Output Contribution: These sectors collectively contributed about 58% of the total output, with output growth of 24.5% and GVA growth of 2.6% compared to 2021-22.
Employment and GVA Comparisons
- Pre-Pandemic Employment Levels: The estimated number of persons engaged in manufacturing industries in 2022-23 is higher than pre-pandemic levels (2018-19) by over 22.14 lakh.
- Average Emoluments Increase: Average emoluments per person in the sector rose by 6.3% in 2022-23 compared to the previous year.
State Employment Contributions:
- The top five states also accounted for about 55% of total manufacturing employment.
Capital Investment Growth
- Gross Fixed Capital Formation: There was a substantial increase in gross fixed capital formation in the manufacturing sector.
- It grew by over 77%, reaching Rs 5.85 lakh crore in 2022-23.
- This marks a significant rise from Rs 3.3 lakh crore in 2021-22.
- Net Fixed Capital Formation: Net fixed capital formation surged by 781.6% to Rs 2.68 lakh crore.
- Manufacturing Sector Profits: Profits in the manufacturing sector grew by 2.7%, reaching Rs 9.76 lakh crore.
Material Stock Changes
- Stock of Materials: In 2022-23, the addition to stock of materials, fuels, and semi-finished goods contracted by over 50%, while the addition to finished goods stock decreased by 36.1%.
- These findings illustrate a strong recovery and growth trajectory for India’s manufacturing sector.
- They highlight significant employment gains and an increase in capital investment in the post-pandemic landscape.
- This positive trend reflects the resilience and potential of the sector as it navigates the evolving economic environment.
Key Highlights from the ASI 2022-23 Results
- The Annual Survey of Industries (ASI) for the financial year 2022-23 presents several notable findings that reflect the health and growth of the manufacturing sector.
- GVA Growth: Gross Value Added (GVA) saw a significant increase of 7.3% in current prices compared to 2021-22.
- Input costs rose by 24.4%, while output grew by 21.5%, indicating a robust production environment.
- Comprehensive Sector Growth: The year 2022-23 marked positive trends across various economic parameters, including invested capital, input, output, GVA, employment, and wages.
- This growth surpassed pre-pandemic levels in absolute terms, highlighting a strong recovery.
- State Contributions: Among the major states, Maharashtra ranked first in terms of GVA, followed closely by Gujarat, Tamil Nadu, Karnataka, and Uttar Pradesh.
- Collectively, these top five states contributed more than 54% of the total manufacturing GVA in 2022-23.
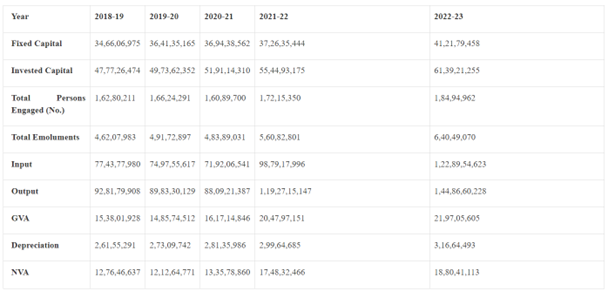
- The value of some key parameters from ASI 2018-19 to ASI 2022-23 in current prices is given in the table.
- The value of some Structural Ratios & Technical Co-efficient from ASI 2018-19 to ASI 2022-23 in current prices is given in the table.
Top Industries
- For a few important characteristics, top five industries at all-India level having major percentage shares in the estimated value of overall aggregate are mentioned in the table below.
Top States
- Top five states in terms of their percentage shares in the value of overall aggregates for each of the characteristics as under:
Visualizations from the ASI 2022-23 Results
- Waterfall chart showing change in absolute value (in ₹ Lakh) in a few important parameters from 2021-22 to 2022-23: All –India
Map showing Top 10 industries account for 72% of Manufacturing GVA:
- Bar chart showing the manufacturing employment by major sub-sectors in 2022-23:
Tamil Nadu's Leading Role in Factory Employment
- Top State in Employment: Tamil Nadu is the state with the highest number of persons employed in manufacturing, accounting for 15% of the total manufacturing workforce in India.
- Total Employment Figures: The total number of persons engaged in factories across India is 1,84,94,962.
- Number of Factories: Tamil Nadu has the highest number of factories, comprising 15.66% of the total 2,53,334 factories in India.
-------------------------------------

Leave a Reply
Your Comment is awaiting moderation.