PREVIOUS
✖
Global Multi-Dimensional Poverty Index (MDPI)
July 30 , 2023
343 days
1470
0
(இதன் தமிழ் வடிவத்திற்கு இங்கே சொடுக்கவும்)
Global Multidimensional Poverty Index
- The index is a key international resource that measures acute multidimensional poverty across more than 100 developing countries.
- It was first launched in 2010 by the OPHI and the Human Development Report Office of the UNDP.
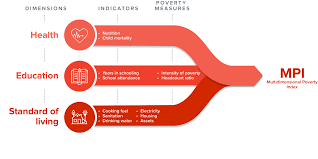
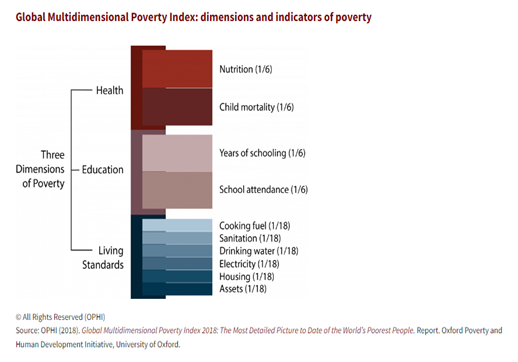
- The MPI monitors deprivations in 10 indicators spanning health, education standard of living.
- It includes both incidence as well as intensity of poverty.
- It has been published annually by OPHI and in the HDRs ever since.
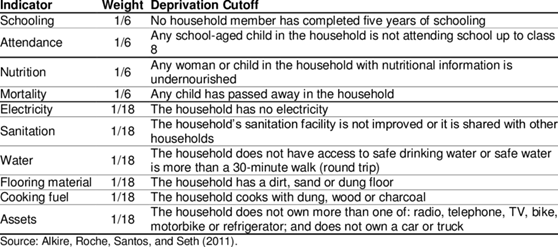
MPI Indicators and Dimensions
- A person is multi dimensionally poor if she/he is deprived in one third or more (means 33% or more) of the weighted indicators (out of the ten indicators).
- Those who are deprived in one half or more of the weighted indicators are considered living in extreme multidimensional poverty.
- It compiles data from 110 developing countries covering 6.1 billion people.
- It is accounting for 92 percent of the population in developing countries.
- It tells an important and persistent story about how prevalent poverty is in the world.
- It provides insights into the lives of poor people and their deprivations.
- Further it describes how it intense their poverty is to inform and accelerate efforts to end poverty in all its forms.
- As still only a few countries have data from after the COVID-19 pandemic, the report urgently calls for updated multidimensional poverty data.
- While providing a sobering annual stock take of global poverty, the report also highlights examples of success in every region.
- The MPI assesses poverty at the individual level.
- If a person is deprived in a third or more of ten (weighted) indicators, the global MPI identifies them as ‘MPI poor’.
- The extent – or intensity – of their poverty is also measured through the percentage of deprivations they are experiencing.
- The global MPI shows who is poor and how they are poor.
- It can be used to create a comprehensive picture of people living in poverty.
- It permits comparisons both across countries and world regions, and within countries by ethnic group, urban/rural area, sub national region, and age group, as well as other key household and community characteristics.
- For each group and for countries as a whole, the composition of MPI by each of the 10 indicators shows how people are poor.
- This makes the MPI and its linked information platform invaluable as an analytical tool to identify the most vulnerable people – the poorest among the poor, revealing poverty patterns within countries.
- Over time, enabling policy makers to target resources and design policies more effectively.
Key findings
Where do poor people live?
- Across 110 countries 1.1 billion out of 6.1 billion people are poor – just over 18% are estimated to live in acute multidimensional poverty.
- 534 million out of 1.1 billion poor people – half of all poor people – live in Sub-Saharan Africa.
- Over a third of all poor people live in South Asia – that’s 389 million people.
- 730 million – nearly two-thirds of all poor people – live in middle-income countries.
- Low-income countries are home to over one-third of all poor people – 387 million.
Who are the poorest?
- The higher the incidence of poverty, the higher the intensity of poverty that poor people experience.
- 485 million poor people live in severe poverty across 110 countries, experiencing 50–100% of weighted deprivations.
- 99 million poor people experience deprivations in all three dimensions (70–100% of weighted deprivations).
- 10 million of the 12 million poor people with the highest deprivation scores (90–100%) live in Sub-Saharan Africa.
Which groups are the poorest?
- Sub-national regions are being left behind in two ways: where poverty is widespread, poverty is also most intense.
- Half of the 1.1 billion poor people (566 million) are children under 18 years of age.
- 84% of all poor people live in rural areas.
- Rural areas are poorer than urban areas in every world region.
What deprivations do poor people face?
- 824–991 million out of the 1.1 billion poor people do not have adequate sanitation, housing or cooking fuel.
- 600 million poor people live with a person who is undernourished in their household.
- Gaps in years of schooling are a cross regional issue: In all regions except Europe and Central Asia, around half of poor people do not have a single member of their household who has completed six years of schooling.
How do monetary and multidimensional poverty compare?
- In 42 of 61 countries more people live in multidimensional poverty.
- Based on the global MPI, more people are in the extreme monetary poverty, according to the World Bank’s $2.15 a day measure.
How has poverty changed?
- 72 of 81 countries, covered well over 5 billion people.
- But nearly all data are from before the COVID-19 pandemic.
- 25 countries halved their global MPI value well within 15 years, showing that progress at scale is attainable.
- In 42 countries-over halves of those covered-children are being left behind.
- In 15 countries, the rate of poverty reduction was outpaced by population growth: The number of poor people increased despite poverty rates declining.
- Cambodia halved its MPI in 7.5 years (2014–2021/2022), including during the COVID-19 pandemic years despite increases in deprivations in school attendance.
The Key Highlights of the Index
Global Outlook
- Globally, 1.1 billion people (18% of the total population) out of 6.1 billion people, are acutely multidimensionally poor and live in acute multidimensional poverty across 110 countries.
- Sub-Saharan Africa has 534 million poor and South Asia has 389 million.
- These two regions are home to approximately five out of every six poor people.
- Children under 18 years old account for half of MPI-poor people (566 million).
- The poverty rate among children is 27.7%, while among adults it is 13.4 %.
Outlook for India
- Poverty in India: India still has more than 230 million people who are poor.
- India has some 18.7% population under this category.
India’s Progress in Poverty Reduction
- India is among 25 countries, including Cambodia, China, Congo, Honduras, Indonesia, Morocco, Serbia, and Vietnam, that successfully halved their global MPI values within 15 years.
- Some 415 million Indians escaped poverty between 2005-06 and 2019-21.
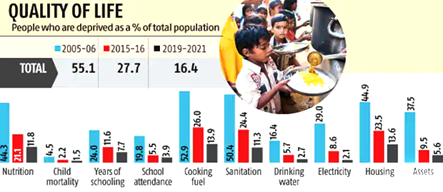
- The incidence of poverty in India declined significantly, from 55.1% in 2005/2006 to 16.4% in 2019/2021.
- In 2005/2006, approximately 645 million people in India experienced multidimensional poverty, a number that decreased to about 370 million in 2015/2016 and further to 230 million in 2019/2021.
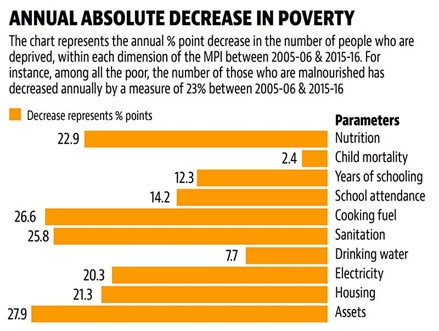
- Improvement in Deprivation Indicators: India progressed significantly in all the three deprivation indicators: Health, Education, Standard of living.
- Decline in poverty has been equal as well, cutting across regions and socio-economic groups.
- The poorest states and groups, including children and people in disadvantaged caste groups, had the fastest absolute progress.
- The percentage of people who were multi dimensionally poor and deprived of nutrition decreased from 44.3% in 2005/2006 to 11.8% in 2019/2021, and child mortality fell from 4.5% to 1.5%.
Recommendations
- There is a need for context-specific multidimensional poverty indices that reflect national definitions of poverty.
- While the global MPI provides a standardized methodology, national definitions offer a comprehensive understanding of poverty specific to each country.
- It is crucial to consider these context-specific indices to evaluate and address poverty effectively.

Leave a Reply
Your Comment is awaiting moderation.