PREVIOUS
✖
Indian states growth after 1991 Part - 01
September 27 , 2024
211 days
2044
0
Indian states growth after 1991 Part - 01
(இதன் தமிழ் வடிவத்திற்கு இங்கே சொடுக்கவும்)
Overview
- This article explores the relative economic performance of Indian states following the 1991 economic liberalization.
- It focuses on two primary indicators: share in India’s GDP and relative per capita income.
- Covering the period from 1960-61 to 2023-24, this analysis highlights how state-specific policies and national reforms have shaped growth trajectories across different regions.
Analytical Framework
Indicators of Economic Performance
1. State Share in National GDP
- Definition: Ratio of a state's Gross State Domestic Product (GSDP) to the sum of GSDP of all states.
- Purpose: Indicates the relative economic importance of states.
- Consistency Note: Discrepancies exist between national GDP estimates and the sum of state GSDP, especially in earlier decades.
- The sum of GSDP of all states is used for consistency in all-India GDP estimates.
2. Relative Per Capita Income
- Definition: Percentage of per capita Net State Domestic Product (NSDP) of the state to all-India per capita Net National Product (NNP) or per capita Net National Income (NNI).
- Data Consideration: Per capita income of states is referenced as NSDP. This measure does not account for remittances, which can significantly affect states like Kerala, Uttar Pradesh, and Bihar.
Historical Context and Data Availability
Starting Point for Analysis
- Year: Analysis begins in 1960 due to the lack of comparable state-level data prior to this period.
Historical Data Compilation
- Initial Estimates: Bombay state was the first to compile official State GDP estimates in 1950 for the year 1948-49.
Subsequent Developments:
- The National Income Committee reports in 1951 and 1954 has prompted states like Uttar Pradesh, Bihar, Madhya Pradesh, Assam, and West Bengal to compile estimates.
- Methodologies varied significantly, making early data non-comparable.
- Standardization Efforts: Initiated by the Central Statistics Office in 1957 to standardize methodologies for compiling State GDP.
State Boundaries
- Adjustments: Efforts have been made to adjust data for the changes in state boundaries during the analysis period, particularly for Uttar Pradesh, Madhya Pradesh, Bihar, and Andhra Pradesh.
Data Source
- Source: Ministry of Statistics and Programme Implementation (MoSPI).
Shares in India’s Economy
- Economic Performance Post-Liberalization
- Karnataka: Transitioned from a middling state to a strong performer.
- Undivided Andhra Pradesh: Also saw considerable improvement in its economic standing.
Consistent Performers
- Maharashtra: Steady economic performance over the years.
- Gujarat: Maintained its strong economic position.
- Delhi: Continued to be a key economic player.
- Haryana: Showed consistent growth and stability.
Declining Performance
- West Bengal: Experienced a persistent relative decline in economic performance compared to other states.
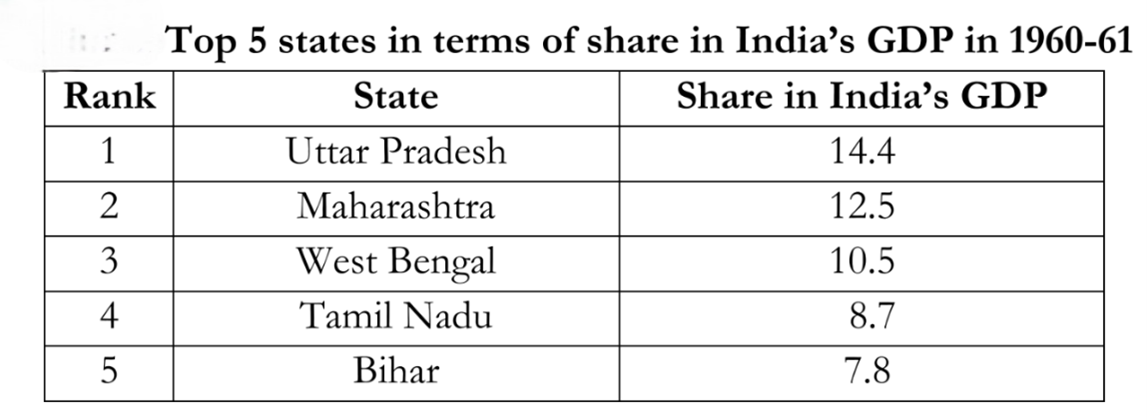
Historical Economic Shares in the 1960s
- In the 1960s, several states held significant shares of India’s total GDP:
- Uttar Pradesh (undivided): 14.4% of India’s total GDP.
- Maharashtra: 12.5% of GDP.
- West Bengal: 10.5% of GDP.
- Tamil Nadu: Held the fourth highest share.
- Bihar (undivided): 7.8% of GDP, higher than states like Gujarat and Karnataka.
Total Contribution of Key States
- The combined economic contribution of these five states amounted to approximately 54% of India’s total GDP in the early 1960s.
- At the time of India's independence, the three presidency towns—Bombay, Calcutta, and Madras—hosted the country's largest industrial clusters.
- This industrial foundation positioned Maharashtra, West Bengal, and Tamil Nadu as the leading economic powerhouses of the 1960s.
- However, their economic paths have diverged significantly since then.
Economic Performance Overview
Maharashtra
- Consistent Growth: Maharashtra has maintained the steady economic performance since independence.
- Current Share: Although there has been a slight decline in its GDP share over the last decade, it continues to hold the highest share among all Indian states.
West Bengal
- Declining Trajectory: West Bengal began experiencing a decline in its economic share as early as the 1960s.
- This downward trend persisted even after the economic liberalization of 1991.
- Current Share: By 2023-24, West Bengal's share of India's GDP had dropped to just 5.6%.
- This decline is significant, as it was 10.5% in 1960-61.
- This represents the largest decrease in GDP share among Indian states.
Tamil Nadu
- Initial Decline and Recovery: Tamil Nadu's economic share decreased from 8.7% in 1960-61 to 7.1% in 1990-91. However, the state experienced a notable turnaround following the 1991 liberalization.
- Current Share: By 2023-24, Tamil Nadu's share of India's GDP had risen to 8.9%, indicating a robust recovery and growth.
Economic Trajectories of Uttar Pradesh and Bihar
- Uttar Pradesh and Bihar were among the top five economic powerhouses in India during the 1960s.
- However, both states have experienced a significant decline in their shares of India's GDP over the decades.
Bihar
- Initial Share: In 1960-61, undivided Bihar contributed 7.8% to India’s GDP.
- Decline Period: The state's share experienced a steady decline for four decades until it reached a low of approximately 4.3-4.4% by 2000-01.
- Stabilization: Since 2000-01, Bihar’s GDP share has stabilized around the 4.3-4.4% range, indicating a cessation of its earlier downward trend.
Uttar Pradesh
- Initial Share: Undivided Uttar Pradesh held a 14.4% share of India's GDP in 1960-61.
- Decline: By 2020-21, this share had fallen to 9.3%.
- Although the rate of decline slowed after 2010, the share only began to show slight improvements in recent years, reaching 9.5% in 2023-24.
Bifurcation and Current Trends
- The trends remain consistent when looking at the current divisions of the states.
Uttar Pradesh (Post-Bifurcation)
- 2000-01 Share: After the division, Uttar Pradesh’s share was 10.2% in 2000-01.
- Decline: This share declined to 8.7% by 2010-11 and further to 8.2% in 2020-21.
- However, there has been marginal improvement recently, with the share reaching 8.4% in 2023-24.
Bihar (Post-Bifurcation)
- 2000-01 Share: Post-bifurcation from Jharkhand, Bihar’s share stood at 2.8% in 2000-01.
- Stagnation: Since then, Bihar's GDP share has remained relatively constant, showing little change.
- The ongoing trends in the economic performance of Uttar Pradesh and Bihar reflect a broader narrative of regional economic shifts in India.
- Both states, once leaders in GDP contributions, have faced challenges that have affected their growth trajectories over the decades.
Comparative Analysis of Economic Decline
Bihar's Decline and Stabilization:
- After experiencing a decline for four decades, Bihar's share has stabilized at approximately 4.3-4.4%.
- This stagnation suggests that while the state has not regained its past prominence, it has found a level where it can maintain economic activity without further deterioration.
Uttar Pradesh's Decline and Recent Improvements:
- Uttar Pradesh's significant drop from 14.4% in 1960-61 to 9.5% in 2023-24 indicates a complex set of economic challenges.
- The state’s marginal improvements in recent years, reaching 8.4%, suggest potential growth strategies are beginning to take effect, albeit slowly.
Implications of Bifurcation
- The bifurcation of these states has led to varied economic landscapes:
- Uttar Pradesh: The division has allowed for focused governance, yet the lingering effects of economic decline are still evident in its share.
- Bihar: The split from Jharkhand initially left Bihar with a significantly lower GDP share, and its struggle to regain economic momentum highlights the need for targeted development initiatives.
Divergent Economic Trajectories of Punjab and Haryana
- In the context of India's economic development, it is the contrasting trajectories of the neighboring states of Punjab and Haryana, which were once part of the same state.
- This divergence is particularly evident in their contributions to India's GDP over the decades.
Historical Economic Performance
Initial Shares (1960-61)
- Punjab: 3.2% of India's GDP
- Haryana: 1.9% of India's GDP
Impact of the Green Revolution
- The Green Revolution significantly boosted agricultural productivity in both states:
- Punjab: Share increased to 4.4% by 1970-71.
- Haryana: Share rose to 2.7% by 1970-71.
Divergent Trends Post-Green Revolution
Punjab
- Plateauing Share: After the initial boost, Punjab’s GDP share plateaued around 4.3-4.4% for two decades.
- Decline: Starting from 1990-91, Punjab's share began to decline steadily, reaching 2.4% by 2023-24. This decline reflects various economic challenges faced by the state, including issues in diversification and agricultural sustainability.
Haryana
- Consistent Growth: In contrast, Haryana's economic share continued to rise after the Green Revolution.
- Current Share: By 2023-24, Haryana’s GDP share was 3.6%. While it has remained relatively stable since 2010-11, the state's growth trajectory indicates resilience and adaptability.
- Role of Gurugram: The success of Gurugram as a major economic and technological hub has likely contributed significantly to Haryana’s increasing GDP share.
Himachal Pradesh
- Initial Share: Himachal Pradesh, also separated from Punjab, had a GDP share of 0.7% in 1970-71.
- Stability: Its share has generally remained around this level since then, indicating a lack of substantial economic growth compared to its neighbouring states.
-------------------------------------

Leave a Reply
Your Comment is awaiting moderation.