PREVIOUS
✖
National Family Health Survey 2019-21 on Tamilnadu (NFHS-5) - Part 01
October 18 , 2024
576 days
28736
0
National Family Health Survey 2019-21 on Tamilnadu (NFHS-5) - Part 01
(இதன் தமிழ் வடிவத்திற்கு இங்கே சொடுக்கவும்)
Introduction
- The National Family Health Survey 2019-21 (NFHS-5) is the fifth iteration in this vital series.
- It offers comprehensive data on population, health, and nutrition across India and its states and union territories (UTs).
- NFHS-5 is built on the framework of NFHS-4 and includes district-level estimates for many critical indicators.
- This feature facilitates detailed comparisons over time.
- While retaining core themes from previous surveys, NFHS-5 introduces several new topics.
- These include preschool education, disability, access to toilet facilities, death registration, menstrual hygiene practices, and aspects of abortion, including methods and motivations.
- The scope of clinical, anthropometric, and biochemical testing (CAB) has also expanded.
- It now includes measurements of waist and hip circumferences.
- Additionally, the age range for blood pressure and glucose assessments has been broadened.
- Notably, HIV testing has been excluded in this round.
- NFHS-5 is designed to yield national, state/UT, and district-level estimates.
- It continues to deliver valuable insights into health and family welfare.
- However, certain sensitive indicators related to sexual behaviour, domestic violence, and HIV/AIDS knowledge are available only at the state and national levels.
- The Ministry of Health and Family Welfare, Government of India, commissioned this survey.
- It is conducted by the International Institute for Population Sciences, Mumbai.
- NFHS-5 aims to provide high-quality data that is essential for monitoring health sector progress.
- The findings will help evaluate existing programs and identify specific areas in need of targeted interventions.
- Ultimately, this data will guide the development of new health initiatives for underserved populations.
State Profile: Tamil Nadu
Geographical Overview
- Tamil Nadu is ranked 11th in India based on geographical spread, covering an area of 130,058 km².
- The state is divided into 38 districts.
Population Statistics
- Tamil Nadu is estimated to have a population of over 7.21 crores, which constitutes approximately 5.94% of India’s total population.
- It is projected that the population will reach around 7.6 crores by 2021.
Scheduled Caste and Scheduled Tribe Demographics
- According to the 2011 Census, the Scheduled Caste (SC) population in Tamil Nadu is approximately 1.44 crores (20.01%).
- The Scheduled Tribe (ST) population is around 0.08 crores (1.10%).
District-Level Distribution
- Among the 38 districts, the top five districts with a dominant ST population account for 45.71% of the ST population in the state.
- The top five districts with a dominant SC population account for 16.40% of the SC population in Tamil Nadu.
State Highways
- Total Length: 12,095 km
- Percentage of Total Road Network: 6.91%
Population Distribution
Rural Population
- Percentage of Total Population: 51.6%
Urban Population
- Percentage of Total Population: 48.4%
Demography
District Population Distribution
- In the state, there are a total of 38 districts.
- Among these, 9 districts have a population of 30 lakhs and above.
- Additionally, 7 districts have populations ranging between 20 and 30 lakhs.
- Thirteen districts have populations between 10 and 20 lakhs.
- Finally, 3 districts have populations of less than 10 lakhs.
Sex Ratio
- The sex ratio at birth in the state is 908 females for every 1000 males.
- This figure is higher than the national average, which stands at 899 females per 1000 males.
Age Distribution
- It is estimated that 14.2% of the total population falls within the age group of 10 to 19 years.
- Furthermore, 59.1% of the population is between the ages of 20 and 59 years.
- The remaining 13.7% of the population is 60 years and above.
Birth and Death Rates
- The crude birth rate in the state has declined from 16.5 in 2005 to 14.2 in 2019.
- Similarly, the crude death rate has decreased from 7.4 in 2005 to 6.1 in 2019.
Literacy Rates
- The literacy rate in the state has seen significant improvement.
- It increased from 73.5% in 2001 to 80.1% in 2011.
- Male literacy stands at 86.8%, while female literacy is at 73.4%.
Gross Enrollment Rate (GER)
- According to the ESAG 2018 report, the Gross Enrollment Rate (GER) for higher education is 44.3%.
- For senior secondary education, the GER is 82.03%.
- The rate for secondary education is 93.92%.
- Additionally, it is 99.94% for elementary education and 103.89% for primary education.
Elderly Population
- Population ageing has profound social, economic, and political implications.
- In Tamil Nadu, elderly individuals aged 60 years and above constitute 13.7% of the total population.
Life Expectancy
- The life expectancy at 60 years of age is 18.1 years for males and 20.0 years for females, based on data from 2014 to 2018.
Economic Dependency
- In Tamil Nadu, 54.0% of elderly females living in urban areas are economically fully dependent on others.
- This is also true for 19.0% of elderly males in urban areas.
- In rural areas, 66.0% of elderly females and 30.0% of elderly males are economically fully dependent on others.
Old Age Dependency Ratio
- The old age dependency ratio in Tamil Nadu was 15.8 in 2011.
- This ratio breaks down to 15.5 for males and 16.1 for females.
- Additionally, the ratio is 16.7 in rural areas and 14.8 in urban areas.
Health Perception
- The perception of illness among the elderly is reported as 30% for men and 32% for women.
- This is slightly above the national average of 31% for both genders.
Maternal Health
- The state has made significant progress in providing Reproductive, Maternal, Newborn, Child, and Adolescent Health services, focusing primarily on primary and secondary care under the National Health Mission (NHM).
Key Indicators
- Indicators such as antenatal care (ANC), institutional deliveries, caesarean sections (C-sections), distribution of iron and folic acid (IFA) tablets, follow-up of high-risk pregnancies, and provision of postnatal and newborn care have shown substantial improvement since 2005, as reported by the National Family Health Survey (NFHS) 4 and 5.
Maternal Mortality Ratio
- The maternal mortality ratio has significantly declined from 97 per 100,000 live births (2007-09) to 60 per 100,000 live births.
Antenatal Care (ANC)
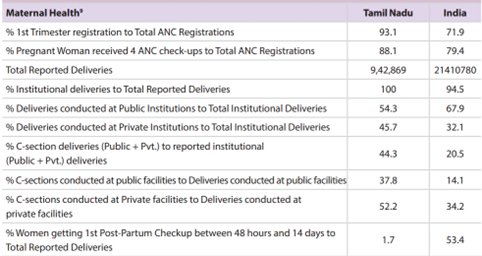
- In Tamil Nadu, 88.1% of women received four ANC check-ups.
- The NFHS 5 report indicates that the districts of Dindigul, Karur, Namakkal, Theni, and Tiruvannamalai reported good ANC coverage, ranging from 95.7% to 98.7%.
- Conversely, Cuddalore, Kancheepuram, Kanniya kumari, Thoothukudi, and Virudhunagar districts reported relatively low ANC coverage, ranging from 76.1% to 84.2%.
Delivery and C-Section Statistics
- According to the Health Management Information System (HMIS) for 2019-20, around 100% of deliveries took place in institutions, with 54.3% occurring in public health facilities.
- The total percentage of C-sections is 44.3%, which is higher than the World Health Organization’s (WHO) recommended standard of 10-15%.
- Notably, about 52.2% of reported C-sections were conducted at private facilities within the state.
Postpartum Care
- Approximately 1.7% of women are tracked for their first postpartum check-up between 48 hours and 14 days after delivery.
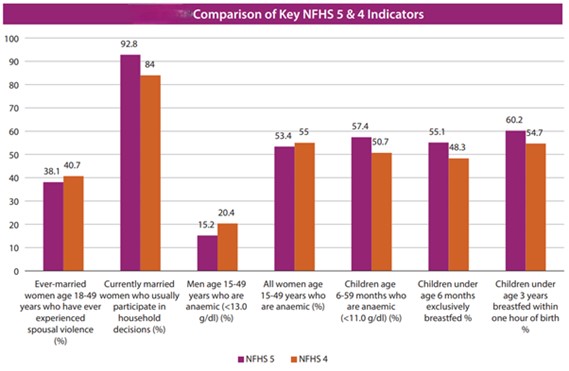
Anemia Prevalence
- The prevalence of anemia among women aged 15-49 years slightly decreased from 55.0% (NFHS-4) to 53.4% (NFHS-5).
- It is important to note that anemia in females of reproductive age is almost three times higher than in men of a similar age group.
Newborn, Infant & Child Health
- Since the inception of the National Health Mission (NHM) in 2005, the state has demonstrated a significant decline in the Infant Mortality Rate (IMR), which dropped from 37 in 2005 to 15 in 2019.
- This rate is exceptionally lower than the national average of 30.
Neonatal Mortality and Stillbirth Rates
- Similarly, the Neonatal Mortality Rate (NNMR) and stillbirth rates (per 1,000 live births) have significantly decreased from 26.2 and 11.2 in 2005 to 10 and 4 in 2018, respectively.
- These improvements can be attributed to various state-level interventions, including infrastructure strengthening under the NHM, such as the establishment of Special Newborn Care Units (SNCUs), Newborn Stabilization Units (NBSUs), and Newborn Care Corners (NBCCs).
-------------------------------------

Leave a Reply
Your Comment is awaiting moderation.