PREVIOUS
✖
National Multi-Dimensional Poverty Index, 2023 - Tamil Nadu
October 17 , 2024
576 days
37554
0
National Multi-Dimensional Poverty Index, 2023 - Tamil Nadu
(இதன் தமிழ் வடிவத்திற்கு இங்கே சொடுக்கவும்)
Introduction
- Poverty has long been understood primarily through the lens of income and consumption, focusing on monetary metrics to assess an individual or household's economic status.
- However, this narrow view often fails to capture the complex realities of poverty.
- The National Multidimensional Poverty Index (MPI), developed by NITI Aayog, takes a more holistic approach by utilizing the Alkire-Foster methodology to assess poverty through multiple dimensions.
- Unlike the global MPI, which considers 10 indicators, the National MPI incorporates 12, offering a richer understanding of deprivation.
- This analysis aims to explore the trends in poverty reduction and the decline in the number of multidimensionally poor individuals over time.
- By examining these trends through a multidimensional lens, we can better appreciate the effectiveness of poverty alleviation efforts and the ongoing challenges that remain.
Overview of Tamil Nadu's Poverty Indicators
- The data presented shows a significant reduction in multidimensional poverty in Tamil Nadu between 2015-16 and 2019-21.
- The headcount ratio, which measures the proportion of people living below the poverty line, decreased from 4.76% to 2.20%.
- Additionally, the intensity of poverty, which indicates the severity of poverty among those who are poor, declined slightly from 39.97% to 38.70%.
- As a result, the overall Multidimensional Poverty Index (MPI) dropped from 0.019 to 0.009.
- These findings suggest that poverty alleviation efforts in Tamil Nadu have been successful in improving the lives of its citizens.
- These indicators collectively demonstrate Tamil Nadu's progress in reducing multidimensional poverty and highlight areas for continued focus.
Multidimensional Poverty in Tamil Nadu's Rural and Urban Area
- In Tamil Nadu, multidimensional poverty has decreased significantly between 2015-16 and 2019-21.
- Rural areas experienced a more substantial reduction in poverty compared to urban areas, with a 59.67% decrease in the headcount ratio and a 62.07% decrease in the MPI.
- The intensity of poverty remained relatively stable in both areas.
- These findings suggest that targeted interventions in rural areas have been effective in reducing poverty.
- The images show the composition of multidimensional poverty in Tamil Nadu for the years 2015-16 and 2019-21.
- The three dimensions of poverty considered are health, education, and standard of living.
- Within each dimension, various indicators are used to assess poverty, such as nutrition, child and adolescent mortality, maternal health, years of schooling, school attendance, sanitation, housing, drinking water, electricity, assets, and bank accounts.
Key observations:
- Health: The percentage of people deprived in the health dimension decreased from 31.02% in 2015-16 to 27.24% in 2019-21.
- This is primarily due to improvements in nutrition and child and adolescent mortality.
- Education: The education deprivation rate declined from 25.70% to 19.62%, with significant gains in years of schooling and school attendance.
- Standard of Living: The standard of living deprivation rate decreased slightly from 43.05% to 41.99%.
- Improvements were seen in sanitation, housing, and assets, but deprivation in electricity and bank accounts persisted.
- Overall, the data indicate a reduction in multidimensional poverty in Tamil Nadu between 2015-16 and 2019-21.
- However, there is still room for improvement, particularly in the areas of standard of living and certain health indicators.
Health:
- Nutrition: 24.77% of the population is malnourished or food insecure.
- Child & Adolescent Mortality: 19.17% of children and adolescents are at risk of mortality or poor health outcomes.
- Maternal Health: 1.15% of pregnant women face mortality or morbidity risks due to inadequate maternal healthcare.
Education:
- Years of Schooling: Only 0.84% of the population has completed their education.
- School Attendance: 6.70% of children and adolescents are not enrolled in school.
Standard of Living:
- Cooking Fuel: 3.31% of households lack access to clean cooking fuel.
- Sanitation: 6.61% of households lack access to proper sanitation facilities and may practice open defecation.
- Drinking Water: 8.53% of the population does not have access to safe drinking water.
- Electricity: 1.03% of households are not connected to the electricity grid.
- Housing: 1.30% of households live in poor housing conditions.
- Assets: 24.06% of households lack essential assets like furniture, appliances, or livestock.
- Bank Account: 15.10% of the population is financially excluded and does not have a bank account.
Health:
- Nutrition: 2.54% of the population is multidimensionally poor and deprived in 2019-21, compared to 3.96% in 2015-16.
- Child and Adolescent Mortality: Decreased from 1.79% in 2015-16 to 1.29% in 2019-21.
- Maternal Health: Decreased from 0.24% in 2015-16 to 0.13% in 2019-21.
Education:
- Years of Schooling: Decreased from 2.24% in 2015-16 to 1.29% in 2019-21.
- School Attendance: Decreased from 2.79% in 2015-16 to 1.64% in 2019-21.
Standard of Living:
- Cooking Fuel: Decreased from 0.59% in 2015-16 to 0.43% in 2019-21.
- Sanitation: Decreased from 4.42% in 2015-16 to 1.86% in 2019-21.
- Drinking Water: Decreased from 1.96% in 2015-16 to 1.16% in 2019-21.
- Electricity: Decreased from 0.39% in 2015-16 to 0.09% in 2019-21.
- Housing: Decreased from 0.41% in 2015-16 to 0.24% in 2019-21.
- Assets: Decreased from 3.96% in 2015-16 to 1.85% in 2019-21.
- Bank Account: Decreased from 1.36% in 2015-16 to 0.36% in 2019-21.
Key observations:
- Regional disparities: There are significant variations in MPI scores across different districts in Tamil Nadu.
- Some districts in the southern and western regions have relatively lower MPI scores, indicating lower levels of poverty, while districts in the northern and eastern parts have higher MPI scores, suggesting higher levels of poverty.
- Concentrations of poverty: Certain regions, such as the Nilgiris, Ramanathapuram, and Virudhunagar districts, have a higher concentration of districts with higher MPI scores, indicating a greater need for targeted interventions to address poverty in these areas.
- Progress in poverty reduction: While some districts have shown progress in reducing poverty, as evidenced by lower MPI scores compared to the previous survey period, others have seen limited improvement or even increases in poverty levels.
Overall performance:
- The map highlights the spatial distribution of multidimensional poverty in Tamil Nadu, revealing regional disparities and areas where targeted interventions are crucial for addressing poverty and improving the well-being of its citizens.
Specific district comparisons:
- Southern districts: Districts like Kanyakumari, Tirunelveli, and Thoothukudi generally have lower MPI scores, indicating lower levels of poverty.
- Northern districts: Districts like Nilgiris, Ramanathapuram, and Virudhunagar have higher MPI scores, suggesting higher levels of poverty.
- Central districts: Districts like Salem, Namakkal, and Erode exhibit a mix of high and low MPI scores, indicating varying levels of poverty within these regions.
Targeted interventions:
- Based on the MPI scores, districts with higher levels of poverty can prioritize targeted interventions to address specific deprivation factors and improve the well-being of their populations.
- These interventions could include programs focused on education, healthcare, infrastructure development, and poverty alleviation schemes.
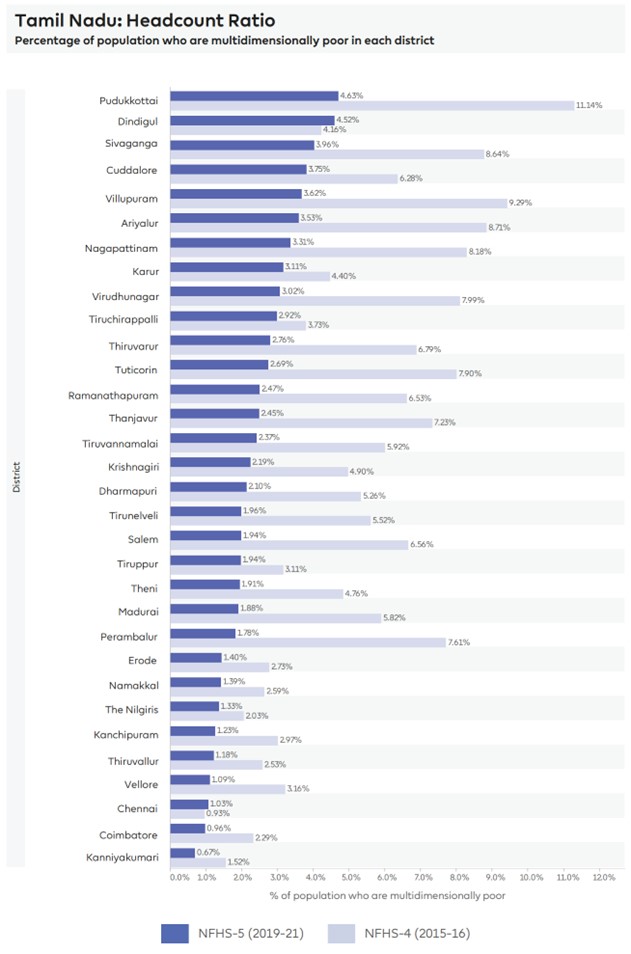
Multidimensional Poverty in Tamil Nadu Districts
- It provides a breakdown of the percentage of the population who are multidimensionally poor in each district of Tamil Nadu, based on data from the National Family Health Survey (NFHS) conducted in 2019-21 (NFHS-5) and 2015-16 (NFHS-4).
Multidimensional poverty rates for each district:
- Pudukkottai has the highest multidimensional poverty rate at 11.14%, followed by Dindigul at 8.4%.
- Chennai has the lowest multidimensional poverty rate at 0.93%.
- Other districts with relatively high multidimensional poverty rates include Sivaganga (8.64%), Ariyalur (8.71%), and Nagapattinam (8.38%).
- Districts with relatively low multidimensional poverty rates include Coimbatore (2.29%), Kanyakumari (1.52%), and Vellore (1.16%).
- Overall, the multidimensional poverty rates in Tamil Nadu have decreased from NFHS-4 to NFHS-5, indicating progress in reducing poverty.
- However, there are still significant disparities between districts, and more efforts are needed to address multidimensional poverty, especially in the districts with higher rates.
Changes in Multidimensional Poverty in Tamil Nadu Districts
- The image provides a district-wise comparison of the percentage point change in the headcount ratio (the proportion of the population who are multidimensionally poor) between 2015-16 and 2019-21 in Tamil Nadu.
Key Findings:
- Overall Improvement: Most districts have experienced a decrease in the headcount ratio, indicating a reduction in multidimensional poverty.
- Significant Reductions: Pudukkottai, Perambalur, Villupuram, and Tuticorin have seen the most significant declines in multidimensional poverty.
- Minimal Changes: A few districts, such as Kanchipuram, Tiruppur, and The Nilgiris, have experienced minimal changes in their headcount ratios.
- Increases: Chennai and Dindigul are the only two districts that have seen slight increases in the proportion of the population who are multidimensionally poor.
Specific District Changes:
- Pudukkottai: The headcount ratio decreased by 6.51 percentage points.
- Perambalur: The headcount ratio decreased by 5.82 percentage points.
- Villupuram: The headcount ratio decreased by 5.66 percentage points.
- Tuticorin: The headcount ratio decreased by 5.46 percentage points.
- Chennai: The headcount ratio increased by 0.37 percentage points.
- Dindigul: The headcount ratio increased by 0.10 percentage points.
- The provided image offers a comprehensive analysis of multidimensional poverty in Tamil Nadu, focusing on the headcount ratio, intensity, and Multidimensional Poverty Index (MPI) for each district based on NFHS-4 (2015-16) and NFHS-5 (2019-21).
Headcount Ratio
- The headcount ratio, which measures the proportion of the population who are multidimensionally poor, has decreased in most districts.
- Significant reductions:
- Ariyalur (from 8.73% to 3.53%),
- Chennai (from 2.29% to 0.96%),
- Coimbatore (from 6.28% to 3.78%),
- Cuddalore (from 2.9% to 1.76%),
- Dharmapuri (from 5.16% to 2.15%),
- Dindigul (from 4.18% to 2.15%),
- Erode (from 2.72% to 1.4%),
- Kanchipuram (from 1.52% to 0.67%),
- Kanyakumari (from 2.9% to 1.25%),
- Karur (from 4.9% to 2.11%),
- Krishnagiri (from 4.4% to 2.19%),
- Madurai (from 5.82% to 1.38%),
- Nagapattinam (from 8.14% to 1.81%),
- Namakkal (from 7.61% to 1.79%),
- Perambalur (from 11.14% to 4.3%),
- Pudukkottai (from 13.14% to 4.53%),
- Ramanathapuram (from 6.56% to 2.44%),
- Salem (from 5.5% to 1.54%),
- Sivaganga (from 7.23% to 2.45%),
- Thanjavur (from 2.4% to 1.36%),
- The Nilgiris (from 8.64% to 2.36%),
- Theni (from 4.7% to 1.18%),
- Thiruvallur (from 2.5% to 1.09%),
- Thiruvarur (from 5.7% to 2.6%),
- Tuticorin (from 6.9% to 2.76%),
- Tiruchirappalli (from 3.11% to 1.96%),
- Tirunelveli (from 3.72% to 1.94%),
- Tiruppur (from 5.11% to 2.57%),
- Tiruvallur (from 3.96% to 1.09%),
- Villupuram (from 7.25% to 3.62%), and
- Virudhunagar (from 6.9% to 3.26%) have all seen reductions.
Intensity
- The intensity of deprivation among the poor has also declined in most districts.
- For example, in Ariyalur, the intensity decreased from 41.75% to 36.92%.
Multidimensional Poverty Index (MPI)
- The overall MPI, which combines headcount ratio and intensity, has decreased for all districts. For instance, Chennai's MPI decreased from 0.033 to 0.014.
Specific District Changes
- Chennai: While the headcount ratio has increased slightly from 2.29% to 0.96%, the intensity has decreased from 40.31% to 37.14%, leading to a stable MPI.
- Dindigul: Both headcount ratio and intensity have increased, resulting in a higher MPI. The headcount ratio increased from 4.18% to 2.15%, and the intensity increased from 38.67% to 47.5%.
- Salem: The headcount ratio has decreased significantly from 5.5% to 1.54%, while the intensity has increased slightly from 44.74% to 38.6%. However, the overall MPI has improved from 0.027 to 0.007.
Conclusion:
- While most districts in Tamil Nadu have made progress in reducing multidimensional poverty, the data highlights the persistent challenges faced by certain regions.
- Further efforts are needed to address the root causes of poverty, particularly in districts that have experienced minimal or no improvement.
-------------------------------------

Leave a Reply
Your Comment is awaiting moderation.